Grocery Prices Barely Rose This Year. So Why Does Your Cart Still Hurt? (2026 Data)
Short answer: groceries are not what is getting worse this year, they are staying high. The Bureau of Labor Statistics says food at home rose 1.8% over the 12 months to September 2026, against 3.7% for all items. But the same grocery index is 31.9% above January 2020, and average hourly pay only caught up with it recently. Three things explain why the cart still hurts: the level never came back down, people feel what they buy most often and what goes up, and a large slice of food money is not groceries at all.
This is general education, not financial advice. The numbers are national averages from official sources I opened on October 30, 2026; they say nothing about your own raise or budget. "Theo" in the video is made up, and my eight-item basket is toy arithmetic, not a real shopping trip.
The quick version, in three steps
1. Look at what changed in the last year, item by item. 2. Look at the level since 2020, not just the last 12 months. 3. Split your own food spending into groceries and meals someone else made. Only then does the feeling turn into a number.
What the receipt says
The BLS publishes average prices for staples. Between September 2025 and September 2026 a dozen large eggs fell from $3.49 to $2.27, about 35%. Milk, bread, bananas and a whole chicken barely moved. Ground beef rose from $6.32 to $6.79 a pound, about 7%, and the CPI shows coffee up 7.1% and beef and veal up 3.5%. The USDA's October 23 outlook expects beef and veal to end 2026 up about 8.7%, and a University of Illinois analysis counted 28.5 million beef cows on July 1, down 1% in a year.
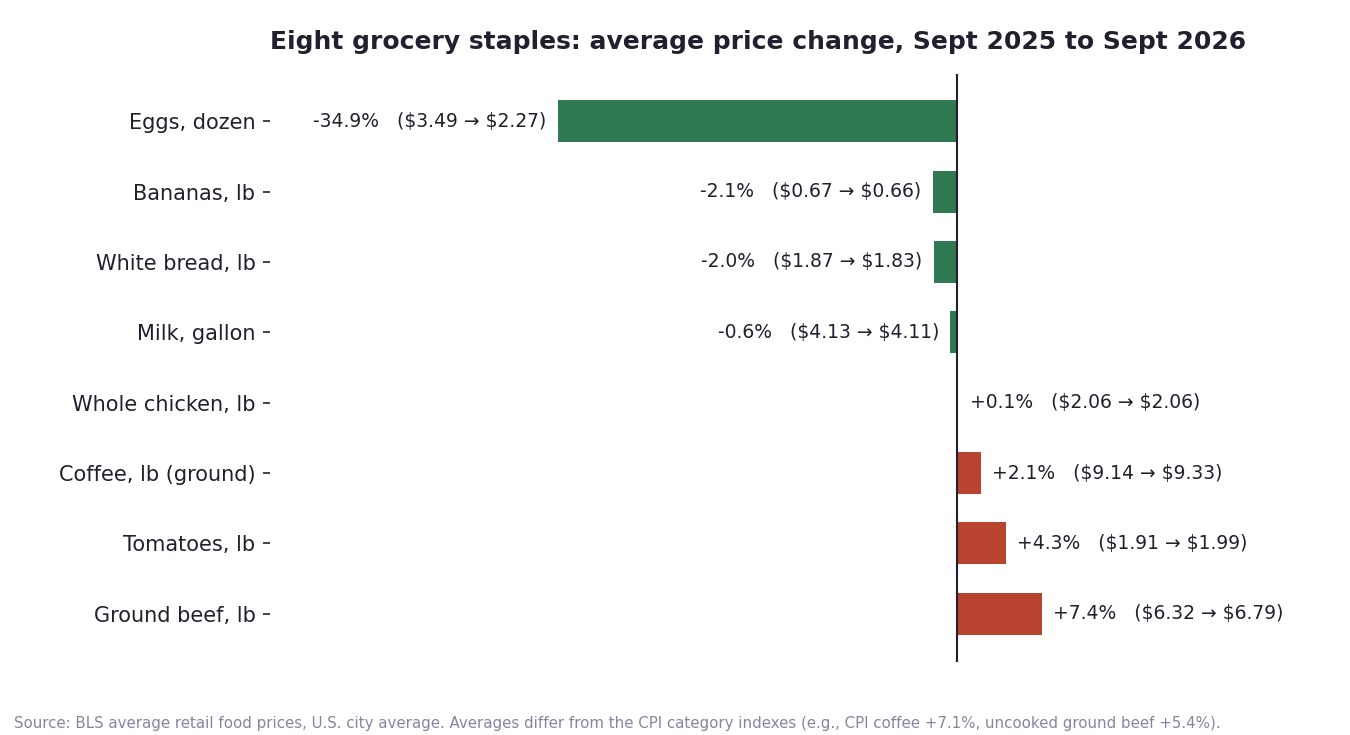
Add one unit of each of those eight items and the basket cost $29.59 last September and $29.04 this September, 54 cents cheaper. That is my arithmetic on published averages, a toy basket, but it shows why "the cart got cheaper" and "the cart feels more expensive" can both be true.
Why a cheaper basket still feels expensive
A 2021 paper in the Journal of Political Economy (D'Acunto, Malmendier, Ospina and Weber) linked shoppers' purchase records to their inflation expectations. Expectations lean on the items people buy most often, in proportion to how often, not how much they spend, and price increases weigh more than equal-sized decreases. An egg price that falls by a third cannot cancel a beef price you see twice a week.
Six years in one number
The seasonally adjusted grocery index stood at 243.5 in January 2020, 301.7 in January 2023 and 321.1 in September 2026. A cart that cost $100 in January 2020 costs about $124 by January 2023 and about $132 now. Most of that jump came before 2023; in the nearly four years since the index has added only about 6%. "Cooling" means the climb slowed, not that prices came back.
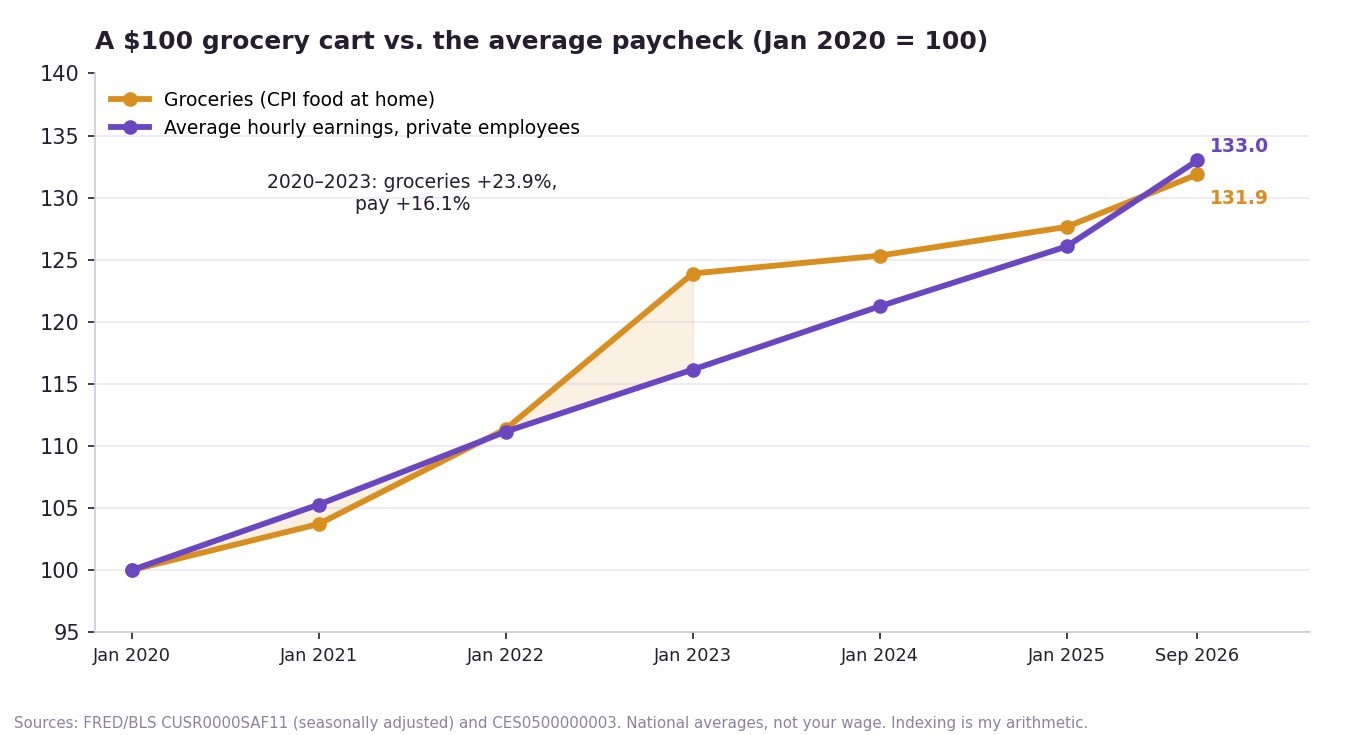
Average hourly earnings of private employees went from $28.43 to $33.02 between January 2020 and January 2023, up 16.1%, while groceries rose 23.9%. For about three years the cart outran the average paycheck by roughly eight points. Since January 2023 pay rose 14.5% and groceries 6.4%, so by September 2026 pay is up 33.0% and groceries 31.9%. On average, pay has caught up, but catching up does not refund the years in between, and an average is not your raise. In minutes of average work, a dozen eggs now costs about 3.6, down from about 5.7 a year ago, while a pound of ground beef costs about 10.8, up from about 10.3.
What is actually running hot
In the same September report gasoline was up 34.2% over the year and energy 20.4%, and food away from home was up 3.5%, almost double the grocery rate. Groceries are the calm part of this year's budget.
Where the food money goes
The BLS Consumer Expenditure Survey for 2025, released on October 29, 2026, puts average household food spending at $10,633, about 13% of all spending. Food at home was $6,491 (roughly $125 a week) and food away from home $4,142 (roughly $80 a week, 39% of the food budget); the BLS flags the one-year changes in those two pieces as not statistically significant. Average pre-tax income was $110,847, and averages are pulled up by high earners, so your proportions may differ. At the farm end, the USDA's Food Dollar series says farms received 11.8 cents of every dollar spent on domestically produced food in 2024; the rest pays for transporting, processing and selling it. For what comes next, the USDA's October outlook expects food-at-home prices up 2.3% in 2026 and 1.0% in 2027, with a range for 2027 from -5.2% to +7.5%: a forecast, not a promise.
A 20-minute receipt audit
- Collect four grocery receipts (or four weeks of card statements).
- Sort every line into three piles: things you buy almost every week, ready-to-eat or convenience items, and one-offs. Add each pile.
- Take the three items you buy most often and find what you paid about six months ago. Those three numbers are your personal grocery inflation.
- Write down the share of your food spending that is meals someone else made, and look at it next to the national 39%. No judgment, just the number.
Want extra income next to a regular paycheck?
Our free three-day side hustle test checks an idea before you spend a weekend on it, and this walkthrough shows how a $7 digital product idea starts. For the full step-by-step method, with prompts and a seven-day plan, there is a paid guide. It does not promise any income.
See the guide (PDF) →FAQ
Are grocery prices still going up in 2026?
Slowly. The BLS reported food at home up 1.8% over the 12 months to September 2026, with eggs down and beef and coffee up. The USDA's October 23 outlook expects food-at-home prices to end 2026 up about 2.3%, and food away from home up about 3.5%.
Why do groceries feel expensive if inflation is cooling?
Cooling means prices climb more slowly, not that they fall back. The grocery index is about 32% above January 2020, and research suggests people weigh the items they buy often, and price increases, more than decreases.
How much does the average American household spend on food?
The BLS Consumer Expenditure Survey for 2025 reports $10,633 on average, of which $6,491 was food at home and $4,142 food away from home. These are averages across all households, not a target for yours.
Have wages kept up with grocery prices?
On average, yes by September 2026: average hourly earnings of private employees are up about 33.0% since January 2020 and groceries about 31.9%. But from 2020 to early 2023 groceries rose faster (23.9% against 16.1%), and an average says nothing about any one person's pay.
How much of what I pay for food goes to farmers?
The USDA Economic Research Service estimates farms received 11.8 cents of each dollar spent on domestically produced food in 2024. The remaining 88.2 cents covers post-farm costs such as transporting, processing and selling.
Sources (opened and read on October 30, 2026): BLS, Consumer Price Index, September 2026 (released October 14, 2026). BLS, Average Retail Food and Energy Prices, U.S. city average (September 2026 and September 2025). FRED, CPI Food at Home, U.S. city average, seasonally adjusted (CUSR0000SAF11), and Average Hourly Earnings of All Employees, Total Private (CES0500000003). BLS, Consumer Expenditures, 2025 (released October 29, 2026). USDA Economic Research Service, Food Price Outlook (updated October 23, 2026), and Charts of Note on the food dollar (April 28, 2026). farmdoc daily, University of Illinois, "Food inflation and the outlook for beef prices" (October 5, 2026). D'Acunto, Malmendier, Ospina and Weber, "Exposure to Grocery Prices and Inflation Expectations," Journal of Political Economy 129(5), 2021. Theo is made up. My own arithmetic: the eight-item basket, the index percentages, the minutes-of-work figures and the weekly amounts. Educational content only, not financial advice.
Keep reading

More from our channels
Jairo Oliva Jofer
Digital nomad. Brazilian living in Serbia. Jairo writes honest, no-fluff guides and tells rise and fall stories on the Icarus Paradox channel. See all guides →